Alaska Pacific University
  • Majors & Institutes
  • Admissions & Costs
  • Student Life & Activities
  • About APU & Our Campus
  • Virtual Campus Tour
  • DONATE
  • Request Info
  • Apply
  • 1 (800) 252 7528
  • myAPU
  • Directory
  • Library
  • Courses
  • Catalog
  • Blackboard
  • (907) 564-8362
  • Skip to primary navigation
  • Skip to main content
  • Skip to primary sidebar
  • Skip to footer
  • myAPU
  • Directory
  • Library
  • Courses
  • Catalog
  • Blackboard
  • (907) 564-8362
  • DONATE
  • Request Info
  • Apply
  • 1 (800) 252 7528
Alaska Pacific University

Discover Active Learning

  • Majors & Institutes
  • Admissions & Costs
  • Student Life & Activities
  • About APU & Our Campus
  • Virtual Campus Tour
  • DONATE
  • Request Info
  • Apply
  • 1 (800) 252 7528
  • myAPU
  • Directory
  • Library
  • Courses
  • Catalog
  • Blackboard
  • (907) 564-8362

Is the Market About to Crash?

February 13, 2014

Written by Dale Lehman, Ph.D., Director of MBA Programs and Professor of Economics at APU

You may have seen buzz like the Wall Street Journal Article, “Scary 1929 market chart gains traction”. There is a generally “Scary Picture” showing an apparent parallel track the stock market is following now to what happened in the crash of 1929. I downloaded the data for the Dow Jones Industrial Average (DJIA) and reproduced the picture as shown here:

figure-1

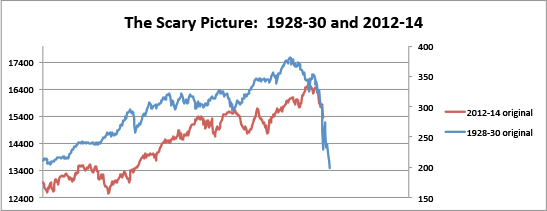
Figure 1: A Scary Picture indeed! But don’t cash in your retirement accounts just yet.

I immediately noticed something strange about the picture – it had two scales, one for 1928-30 and one for 2012-14. This was required because the DJIA was one hundred times lower 85 years ago than today. Fine, but when I downloaded the original data, and used two scales, I got this picture:
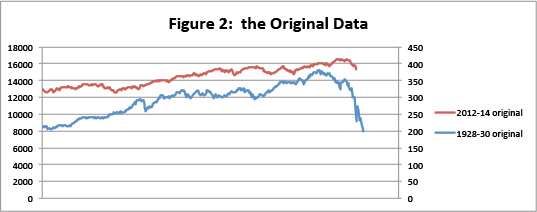
Figure 2

Figure 2

This picture is not as scary (though scary enough). In order to get the publicized Scary Picture, not only are dual scales needed, but the vertical scales need NOT to start at zero, but at fixed numbers (12400 for the recent data; 150 for the 1928-30 data).

I was not the only person to notice the importance of the dual scales (you can read the comments on the original Market Watch post). Since the recent DJIA involves much higher numbers, the seemingly parallel movement is a much smaller percentage change in the past 2 years than it was 85 years ago. This becomes evident if you graph the percentage changes or put them on a common scale (starting at 100), as I do in Figure 3:
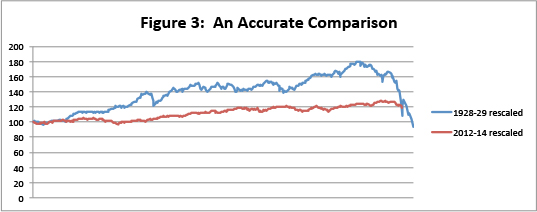
Figure 3

Figure 3

This picture is far less scary and the parallel is not so evident.

But wait—as the MarketWatch post points out, there can still be a strong correlation, and indeed there is. The correlation in the daily movement of the DJIA in 1928-30 and 2012-14 is 0.84 which is a high correlation. The only problem is that I can find an even higher correlation if I compare 2012-14 with the 1988-90 time period, as in Figure 4:
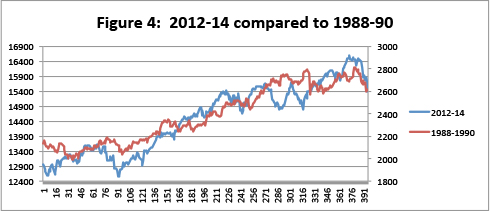
Figure 4

Figure 4

I selected the 1988-90 period because it was a similar rising period for the DJIA but was NOT followed by the market crashing. Don’t trust the picture, however, since there are two scales. The correlation in the daily DJIA between 1988-90 and 2012-14 was 0.92, higher than in The Scary Picture!

What can we learn from these comparisons? Not much, except that we should not readily trust even (perhaps especially) the experts. I can’t say that they sought to intentionally mislead you – although a fair amount of manipulation was required to produce The Scary Picture, and the experts hardly are objective observers. The correlation to the market crash in 1929 is, in fact, high, but not as high as my hand selected 1988-90 time period when the market did not crash. Perhaps the experts were being careless or perhaps they were seeking to scare investors. And, the market may yet crash. But my point is that the Scary Picture is worthless. This is why I don’t trust other peoples’ analysis of quantitative data. It is not that hard to download the data yourself an produce your own graphics and your own correlations. The fact that The Scary Picture has been circulating on Wall Street for months is genuinely scare to me. It is time that you educate yourself on basic quantitative skills and visual display of quantitative data. It is your money, after all.

Filed Under: Master of Business Administration

Primary Sidebar

Categories

  • Active Learning (172)
  • Admissions (17)
  • Advancement (12)
  • Alaskan Culture (9)
  • Alumni (12)
  • APU Spotlight (34)
  • Business Administration and Management (12)
  • Business Administration Department (23)
  • Commencement (5)
  • Community (45)
  • Consortium Library News (2)
  • Coronavirus Updates (34)
  • Counseling Psych & Human Services (6)
  • Counseling Psychology (6)
  • Early Honors (6)
  • Earth Science (11)
  • Education (7)
  • Environmental Public Health (1)
  • Environmental Science (33)
  • Expedition Alaska (4)
  • Faculty (3)
  • Farmers Market (4)
  • FAST Lab (7)
  • Featured Item (21)
  • Geology (2)
  • Graduation (4)
  • Kellogg Campus (20)
  • Liberal Studies (51)
  • Marine Biology (26)
  • Master of Arts (5)
  • Master of Business Administration (16)
  • MS Environmental Science (16)
  • MSOEE (7)
  • News Page (5)
  • Newsletter (4)
  • Nordic Skiing (21)
  • Nursing & Health (6)
  • Outdoor Studies (22)
  • President's Blog (34)
  • Press Releases (42)
  • Raven Reconnaissance (3)
  • Recently completed theses (7)
  • Research (15)
  • Scholarships (2)
  • Spring Creek Farm Journal (4)
  • Student Activities (15)
  • Student Stories (12)
  • Sustainability Studies (22)
  • We Are APU (39)
  • World Class (34)

Recent Blog Posts

APU receives further funding for key business infrastructure from Northrim Bank

May 16, 2022

Nursing programs receive national accreditation and commendation for cultural safety curriculum

April 26, 2022

Strategic Plan Update

March 24, 2022

Alumni survey: The results are in

March 23, 2022

Message from Hilton Hallock - updated Covid protocolAPU Announces Mask-Optional Policy

March 18, 2022

Speaker in commencement robesSpring 2022 Commencement Update

March 3, 2022

“The value of this connection is unexplainable:” EPH students visit Napaskiak

May 31, 2022

You Are Here: Home / Master of Business Administration / Is the Market About to Crash?

Footer

Alaska Pacific University
4101 University Drive • Anchorage, Alaska 99508
  • Careers
  • Donate
  • Conferencing Services
  • Campus Store
  • Transcripts

© 2022 Alaska Pacific University · All Rights Reserved · Notice Regarding Web Accessibility · Privacy Policy · Website Credits